- US equities initially embraced a miss in US PPI figures, but downside factors weigh.
- Large bank earnings broadly missed the mark on Friday, plaguing US equities.
- Next Wednesday’s US Retail Sales to be the linchpin in sentiment next week.
US equity markets rallied in early NY trading hours on Friday after the US Producer Price Index (PPI) declined faster than market models predicted as producer-level inflation continues to ease, even after Thursday’s US Consumer Price Index (CPI) showed consumer inflation accelerated unexpectedly in December.
The US PPI print came in broadly below forecasts, with the MoM PPI for December declining -0.1%, in-line with the previous month’s -0.1% decline (revised down from 0.0%), missing the median market forecast of a 0.1% rebound.
Core PPI figures in December also missed expectations also missed the mark, printing a flat 0.0% to match the previous month while markets were anticipating a 0.2% step up.
The good mood in US equities saw limited impact as traders pulled back heading into the closing bell, with investors gearing up for next Wednesday’s US Retail Sales print, where markets are hoping for a step up to 0.4% MoM in December compared to November’s 0.3%.
Large bank earnings reports disappointed on Friday, further hampering sentiment despite an overall decline in Treasury yields on the day, with major indexes getting dragged down by banks reporting less-than-stellar earnings reports. Inflation continues to take the priority spot for investors, as money markets hope that Thursday’s CPI uptick was merely a one-off with traders pricing in up to 160 basis points in rate cuts from the Federal Reserve by the end of 2024, compared to 154 bps from earlier this week. Airlines also disappointed investors, adding to index woes as travel growth continues to struggle.
The Standard & Poor’s 500 and NASDAQ Composite both posted slight gains of 0.8% and 0.3% respectively, with the S&P 500 climbing 3.59 points to end Friday at $4,783.83 while the NASDAQ rose 2.57 points, ending the trading week at $14,972.76.
The Russell 2000 index fell -0.23% to close at $1,950.96, while the Dow Jones Industrial Average (DJIA) fell nearly 120 points, closing down around three-tenths of a percent to wrap up the trading week at $37,592.98.
DJIA Technical Outlook
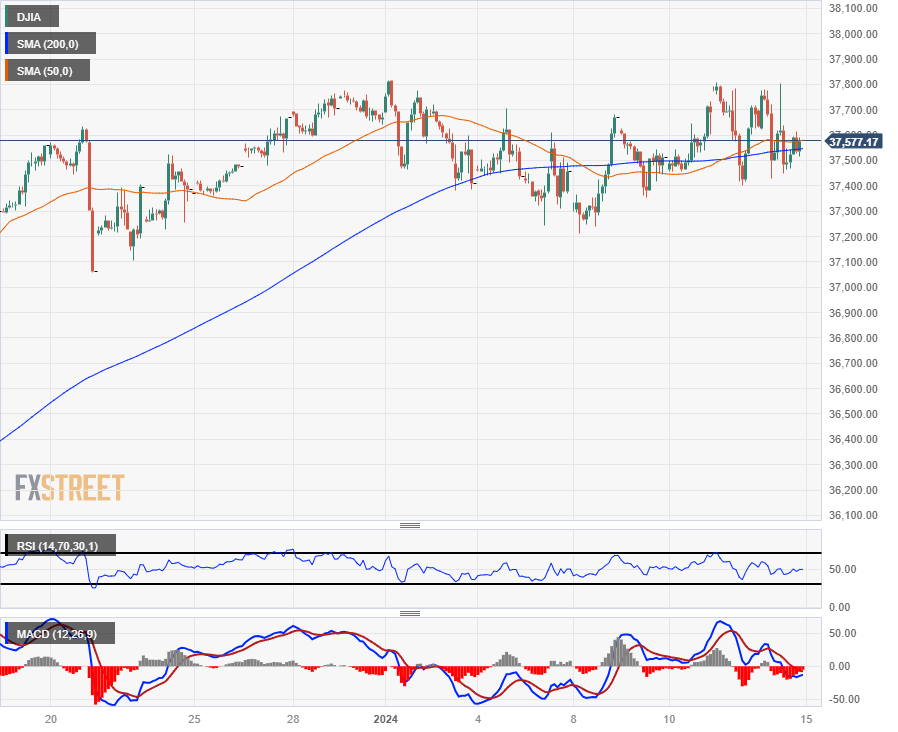
The DJIA remains trapped in near-term consolidation, trading into familiar levels that have plagued the major equity index since climbing to record highs in December. A hard ceiling has been priced into intraday charts from $37,800.00 as intraday price action trades back into the 200-hour Simple Moving Average (SMA) just above $37,500.00.
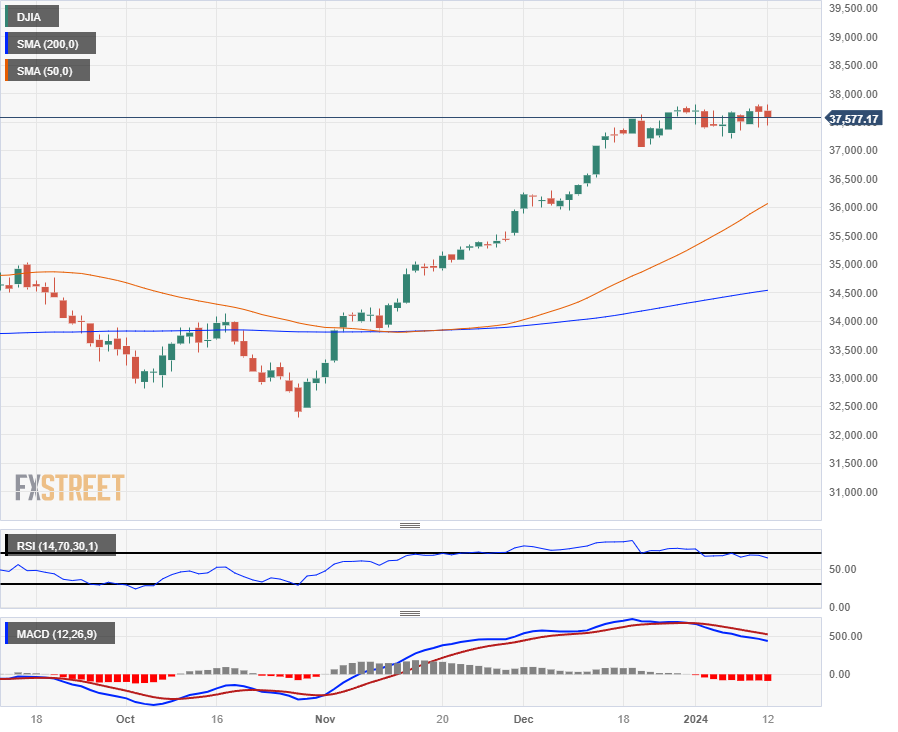
The DJIA’s rise on daily candlesticks has the equity index trading well above the 200-day SMA near $34,500. The 50-day SMA is climbing through the $36,000 major handle, and could chalk in a technical floor to fend off any bearish downturns.
DJIA Hourly Chart
DJIA Daily Chart
DJIA Technical Levels
DJIA
| OVERVIEW | |
|---|---|
| Today last price | 37577.17 |
| Today Daily Change | -102.62 |
| Today Daily Change % | -0.27 |
| Today daily open | 37679.79 |
| TRENDS | |
|---|---|
| Daily SMA20 | 37483.05 |
| Daily SMA50 | 36148.15 |
| Daily SMA100 | 35018.15 |
| Daily SMA200 | 34559.27 |
| LEVELS | |
|---|---|
| Previous Daily High | 37805.9 |
| Previous Daily Low | 37399.35 |
| Previous Weekly High | 37817.46 |
| Previous Weekly Low | 37245.19 |
| Previous Monthly High | 37777.48 |
| Previous Monthly Low | 35894.73 |
| Daily Fibonacci 38.2% | 37554.65 |
| Daily Fibonacci 61.8% | 37650.6 |
| Daily Pivot Point S1 | 37450.79 |
| Daily Pivot Point S2 | 37221.8 |
| Daily Pivot Point S3 | 37044.24 |
| Daily Pivot Point R1 | 37857.34 |
| Daily Pivot Point R2 | 38034.9 |
| Daily Pivot Point R3 | 38263.89 |


