Natural Gas continues its downward trend as bearish factors accumulate.
Traders are driving gas prices lower, signaling potential for extended period of low pricing.
The US Dollar Index remains unchanged this week, awaiting PPI and Michigan data.
The price of Natural Gas (XNG/USD) is currently hovering near its lowest levels since mid-2020, trading around $1.65. Downward pressure persists, fueled by diminishing demand not only in Europe but also in the US. The descent towards $1.50 suggests the possibility of Natural Gas prices entering a prolonged period of significantly lower levels due to oversupply amidst tepid global demand.
Meanwhile, the US Dollar (USD) has retraced to its Monday levels. Weakening Retail Sales figures from Thursday counteracted the impact of the high inflation report earlier in the week. Traders are now poised to close positions on the US Dollar Index (DXY) based on upcoming US Producer Price Index (PPI) and University of Michigan data releases.
Key Events Impacting the Natural Gas Market:
- Eni reported fourth quarter profits in line with expectations, with profits from the Natural Gas segment compensating for weakness in refining and chemicals.
- A Natural Gas Pipeline in Iran near Bakhtiari province was hit by explosions in an act of sabotage, as confirmed by Iranian officials.
- Above-average temperatures over the weekend in Europe are limiting short-term withdrawals of Gas from storage facilities.
- European gas storage levels remain high at 66%, surpassing the 5-year average of 50% for this period.
Natural Gas Technical Analysis: Caution Advised, Further Declines Expected
Natural Gas faces challenges in finding support levels amidst short-term and long-term issues, including slowing global growth and the transition away from fossil fuels. The Relative Strength Index (RSI) indicates an “oversold” condition, suggesting potential for prolonged downward pressure.
Key Technical Levels for Natural Gas:
- Immediate resistance at $1.99, followed by $2.13, a significant level from 2023.
- Potential upside towards $2.40 if demand increases unexpectedly.
- Resistance at $1.80, a pivotal level from July 2020, which may now act as a barrier.
- Downside targets at $1.64 and $1.53 (the 2020 low) in case of increased supply or worsening global economic data.
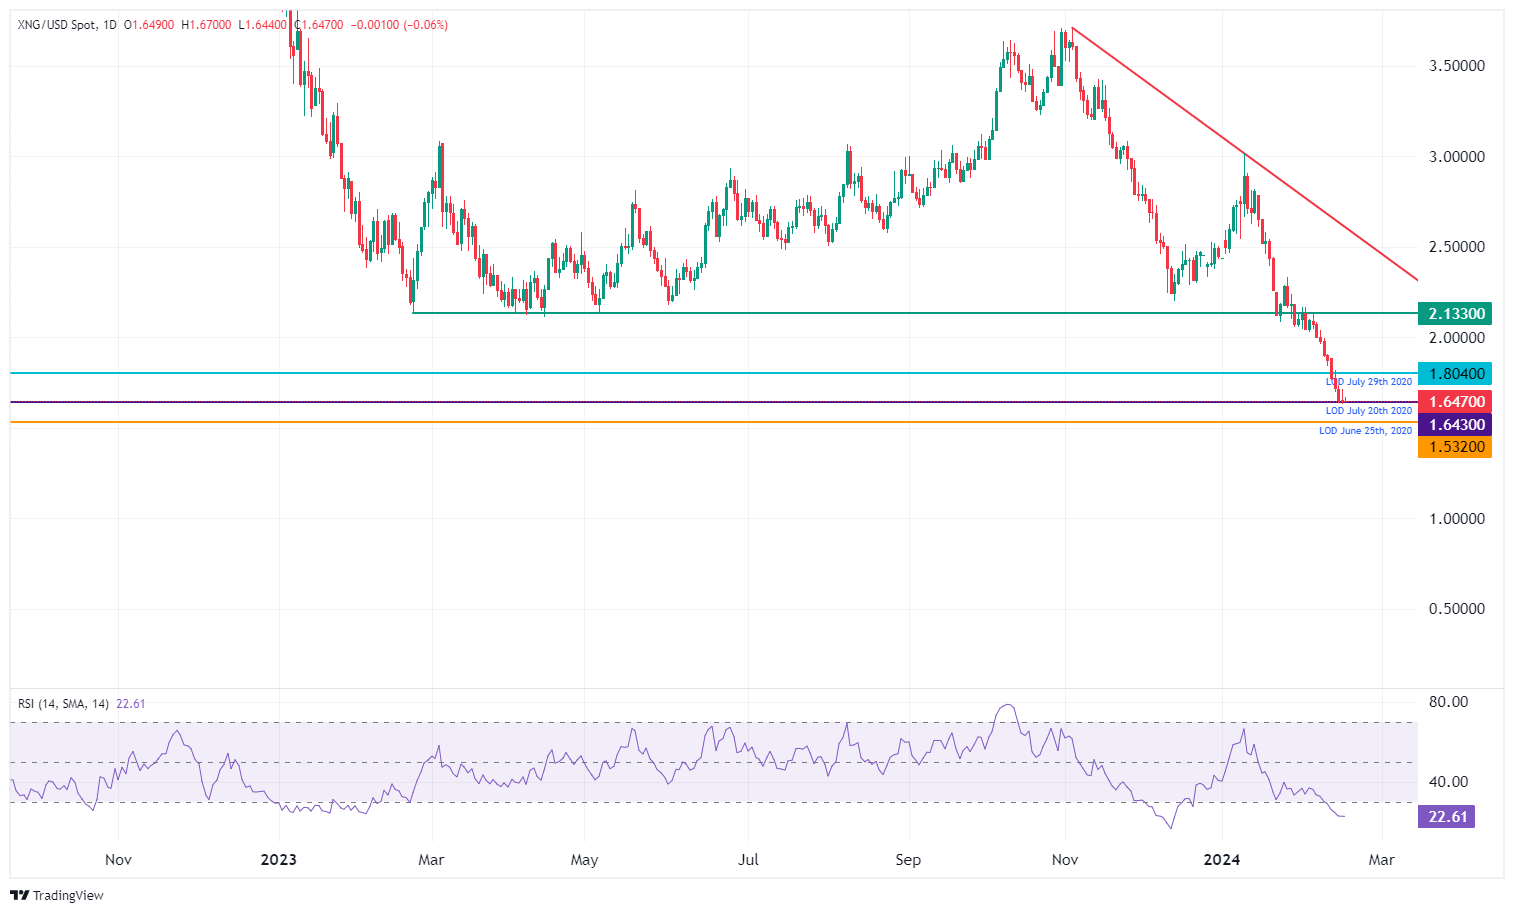
XNG/USD (Daily Chart)
NATURAL GAS FAQS
What fundamental factors drive the price of Natural Gas?
Supply and demand dynamics are a key factor influencing Natural Gas prices, and are themselves influenced by global economic growth, industrial activity, population growth, production levels, and inventories. The weather impacts Natural Gas prices because more Gas is used during cold winters and hot summers for heating and cooling. Competition from other energy sources impacts prices as consumers may switch to cheaper sources. Geopolitical events are factors as exemplified by the war in Ukraine. Government policies relating to extraction, transportation, and environmental issues also impact prices.