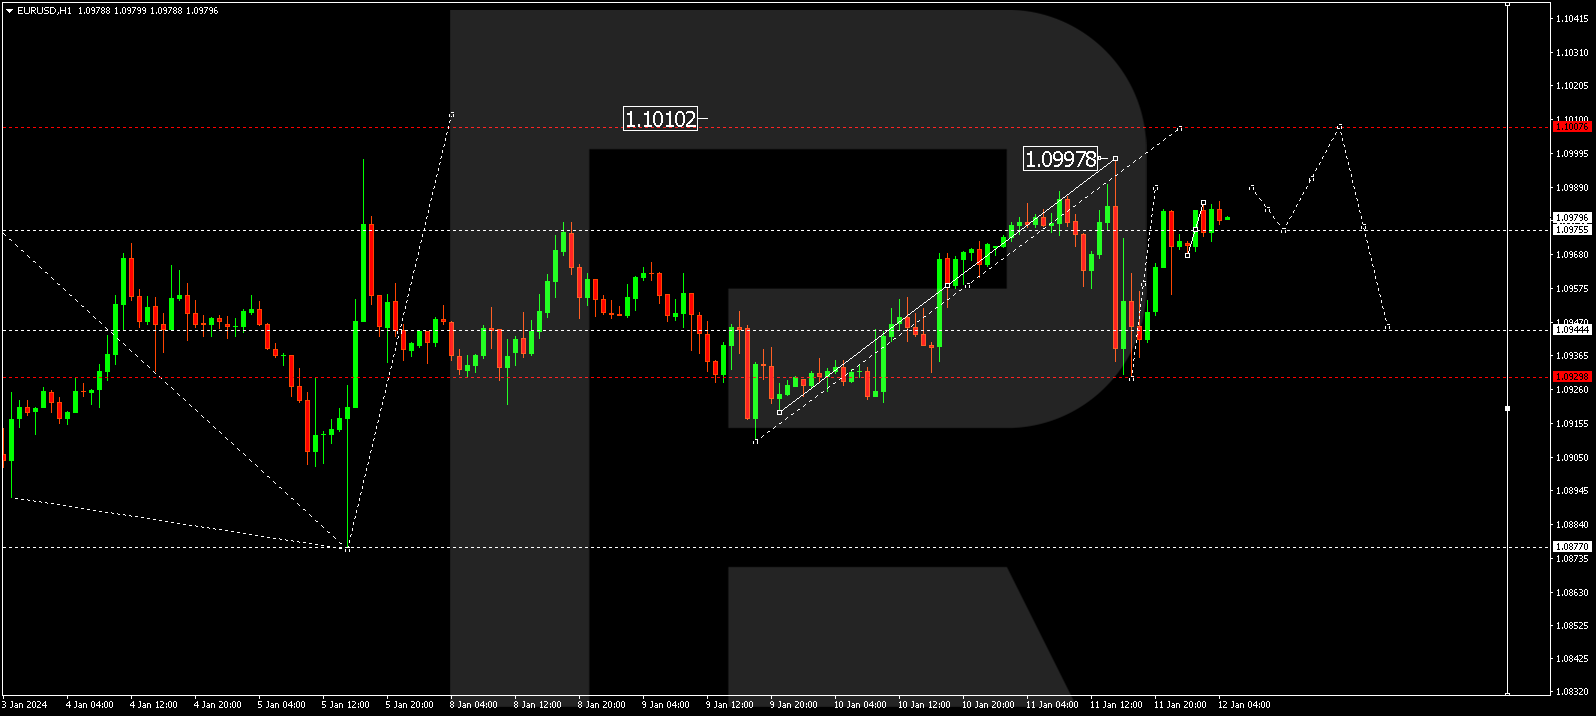
EUR/USD, “Euro vs US Dollar”
EURUSD has completed a growth wave to 1.0997 and a correction to 1.0930. Today the market is forming a new growth structure to 1.1010. Upon reaching this level, a decline wave to the 1.0944 level is expected, from where the trend might continue to 1.0877. This is a local target.
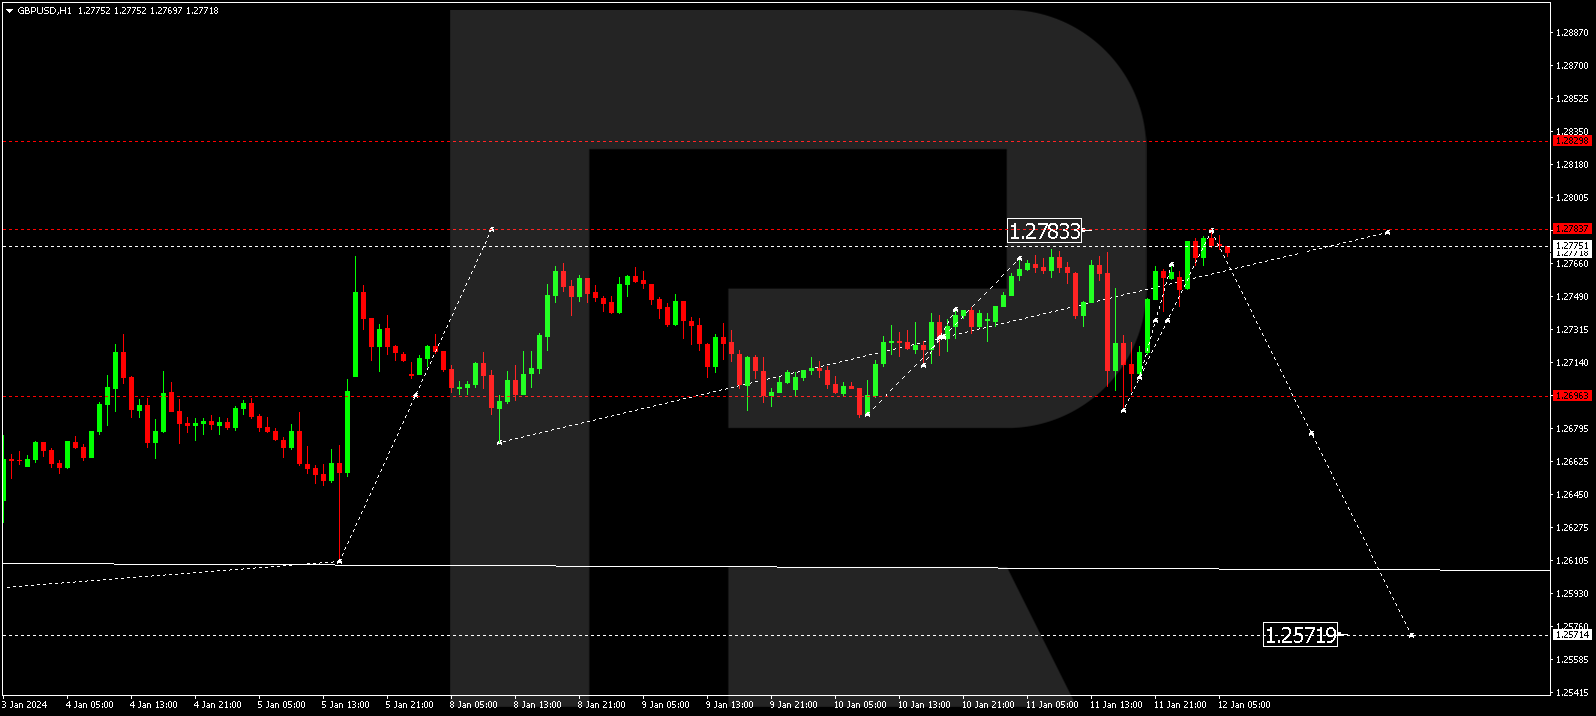
GBP/USD, “Great Britain Pound vs US Dollar”
GBPUSD has completed a decline wave to 1.2690. Today it has formed a growth wave to 1.2782, under which level a consolidation range might develop. With a downward escape from the range, the quotes could drop to 1.2772. With an upward escape, a growth link to 1.2840 is not excluded. Next, the price might go down by the trend to 1.2666. This is a local target.
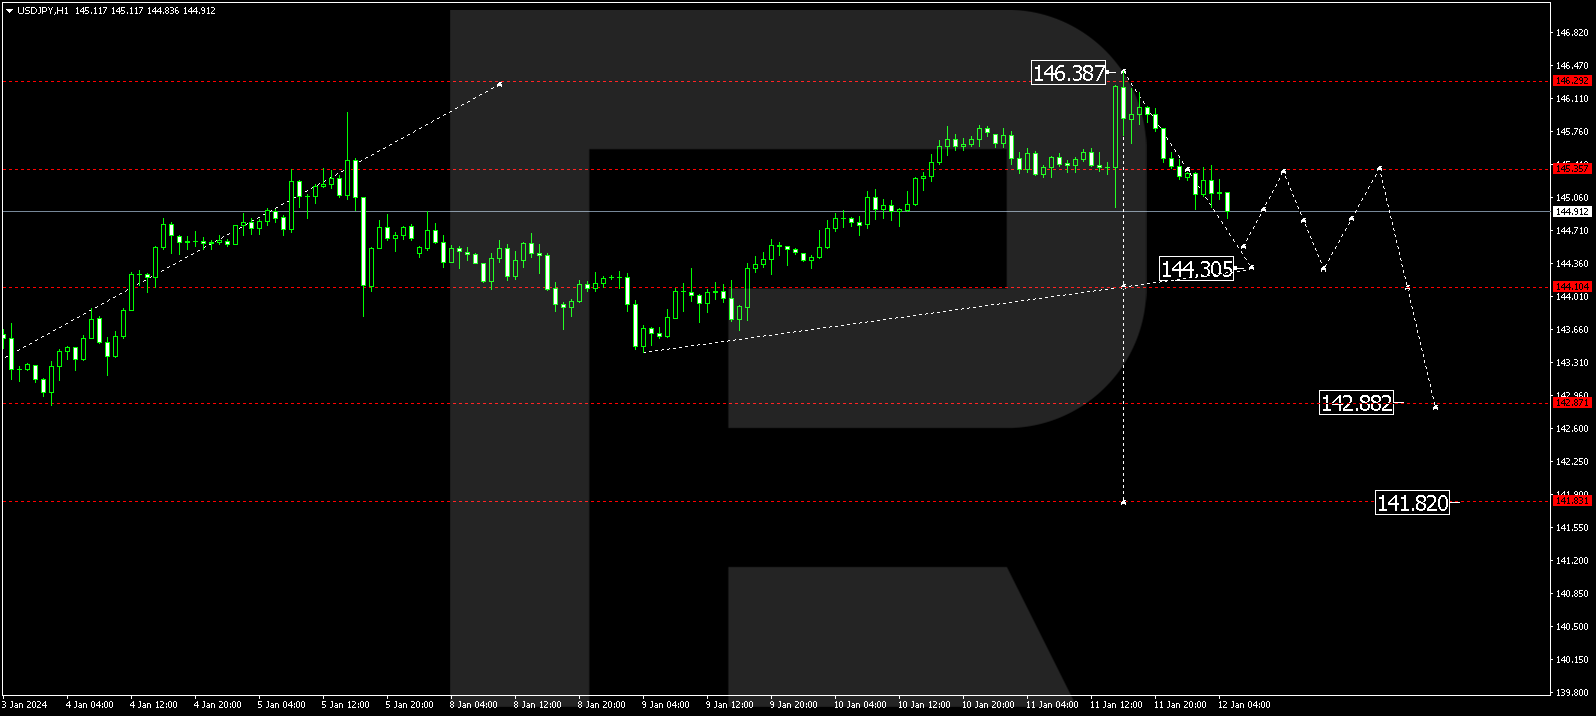
USD/JPY, “US Dollar vs Japanese Yen”
USDJPY continues developing a decline wave to the 144.30 level. Next, a correction link to 145.35 is expected, followed by a decline by the trend to 142.88. This is a local target.
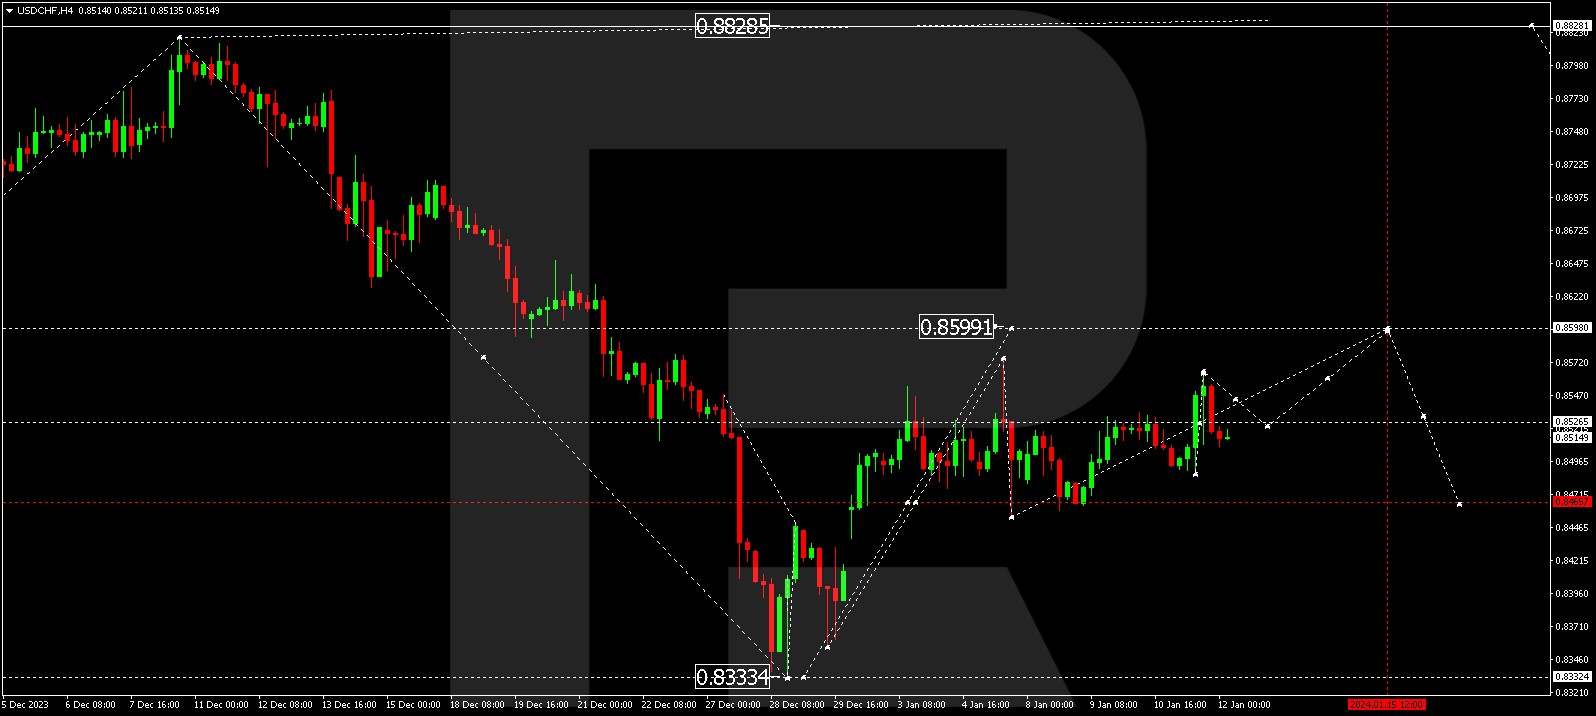
USD/CHF, “US Dollar vs Swiss Franc”
USDCHF continues developing a consolidation range around 0.8530. Today the range is expected to extend upwards to 0.8598. This is the first target. Next, a correction to 0.8457 might follow.
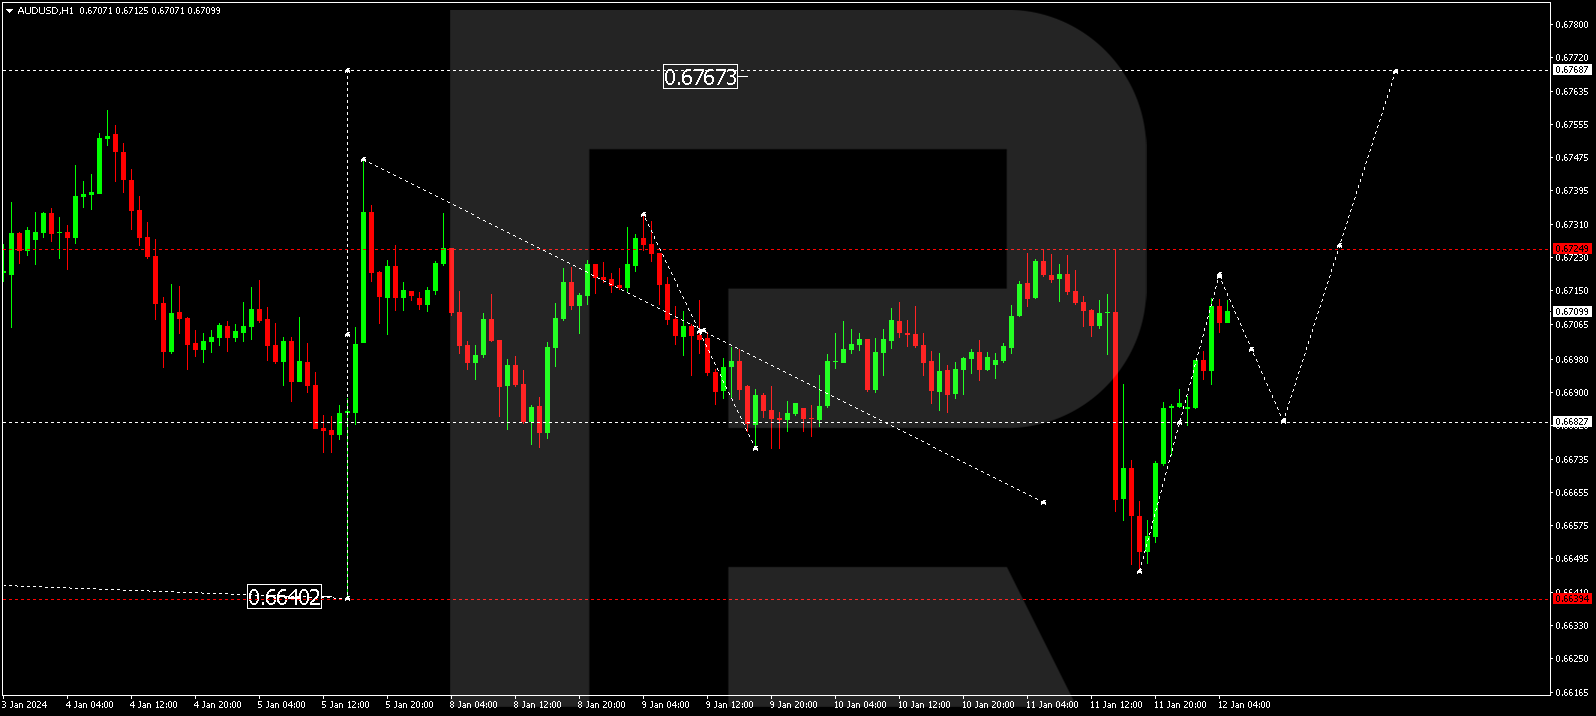
AUD/USD, “Australian Dollar vs US Dollar”
AUDUSD continues developing a growth link to 0.6720. Next, the price could drop to 0.6680, from where the trend might extend to 0.6640. This is a local target.
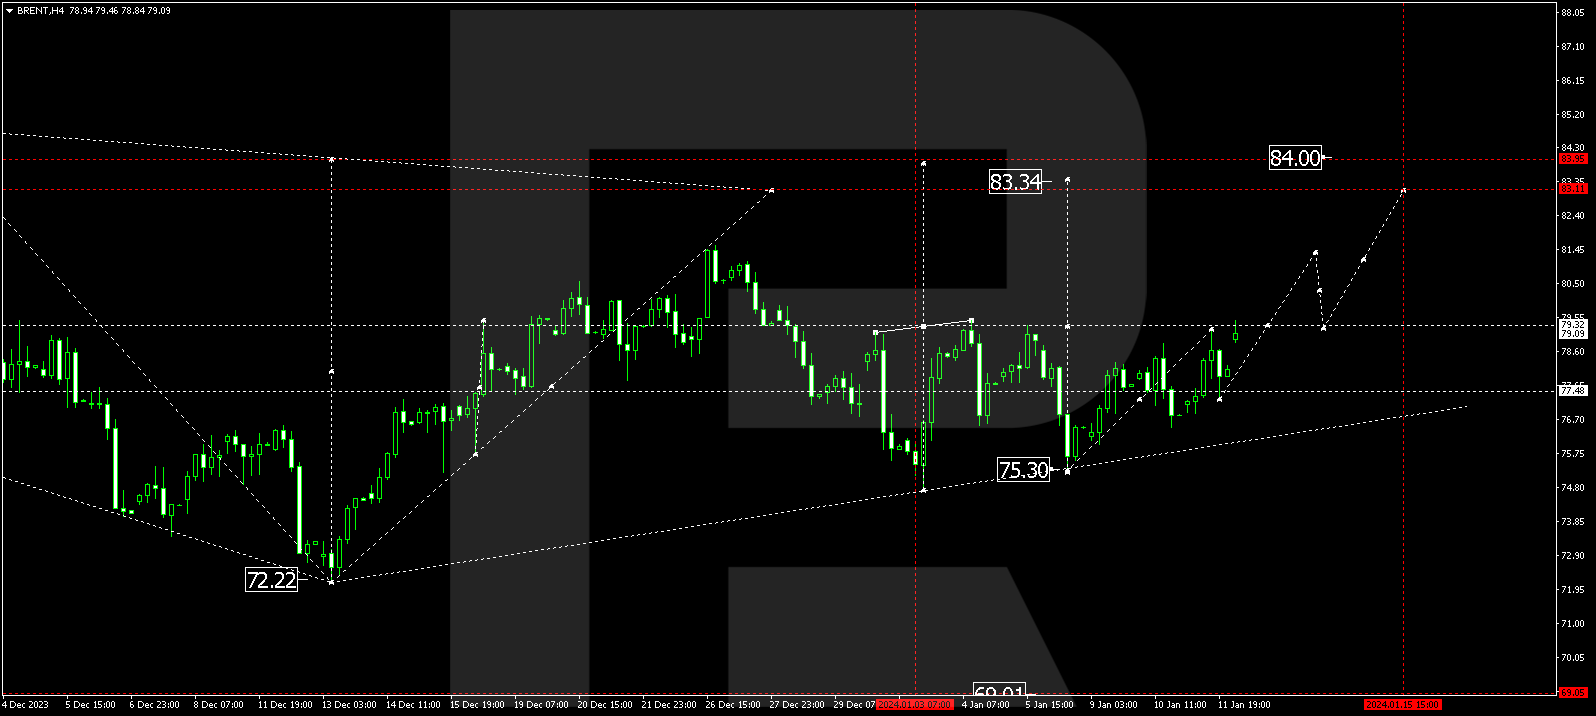
Brent
Brent has completed a growth link to 73.46. A consolidation range is currently forming around this level. An upward escape from the range is expected, so that the growth wave could continue to 83.11. This is a local target. Next, the quotes might correct to 79.50 and grow to 84.00.
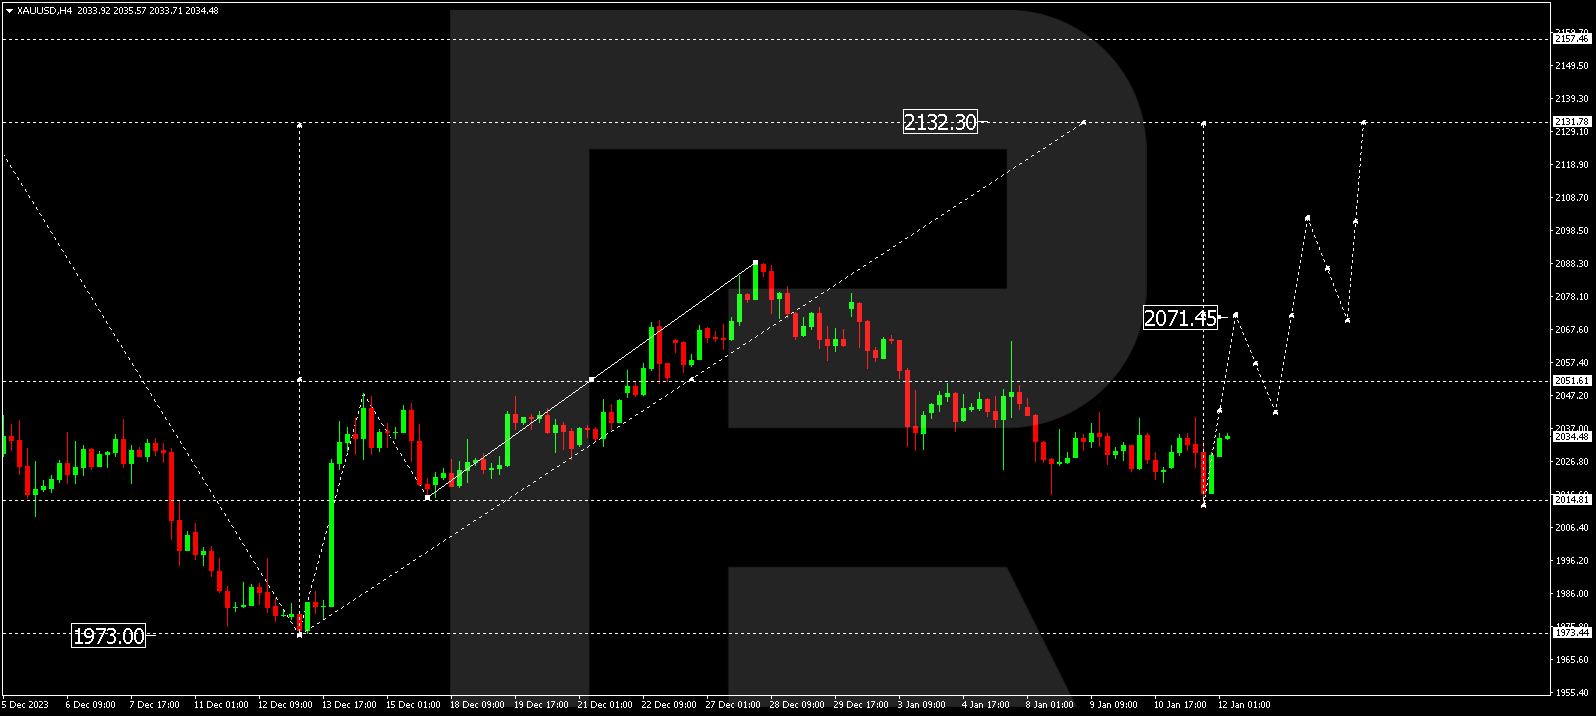
XAU/USD, “Gold vs US Dollar”
Gold has completed a correction to 2013.22. Today the market has started a new growth wave to 2071.45. This is the first target. Once this level is reached, the quotes might correct to 2045.00. Next, a rise to 2099.00 might follow, from where the trend could continue to 2131.80.
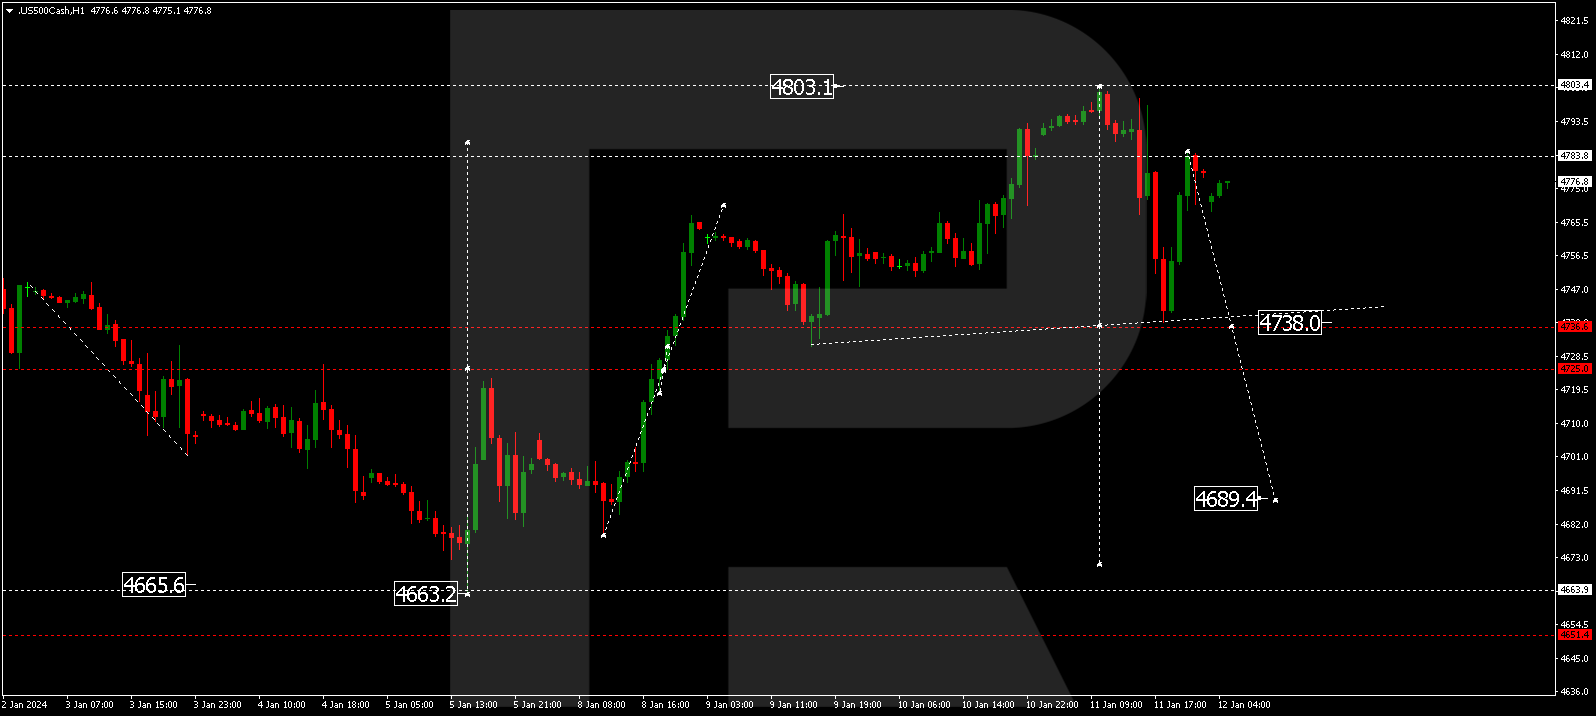
S&P 500
The stock index has completed a decline wave to 4738.0 and a correction to 4783.8. A consolidation range might form under this level. With a downward escape from the range, the potential for a decline wave to 4689.5 might open. This is a local target.