- Silver’s recent rally to $23.52 curbed by resistance at 50 and 200-DMAs, leading to a slight pullback in prices.
- Technical analysis shows Silver trading in a sideways trend; immediate support at $23.00, followed by $22.48.
- Potential for further gains if Silver breaks above the 100-DMA at $23.25, targeting the $23.60/65 resistance zone.
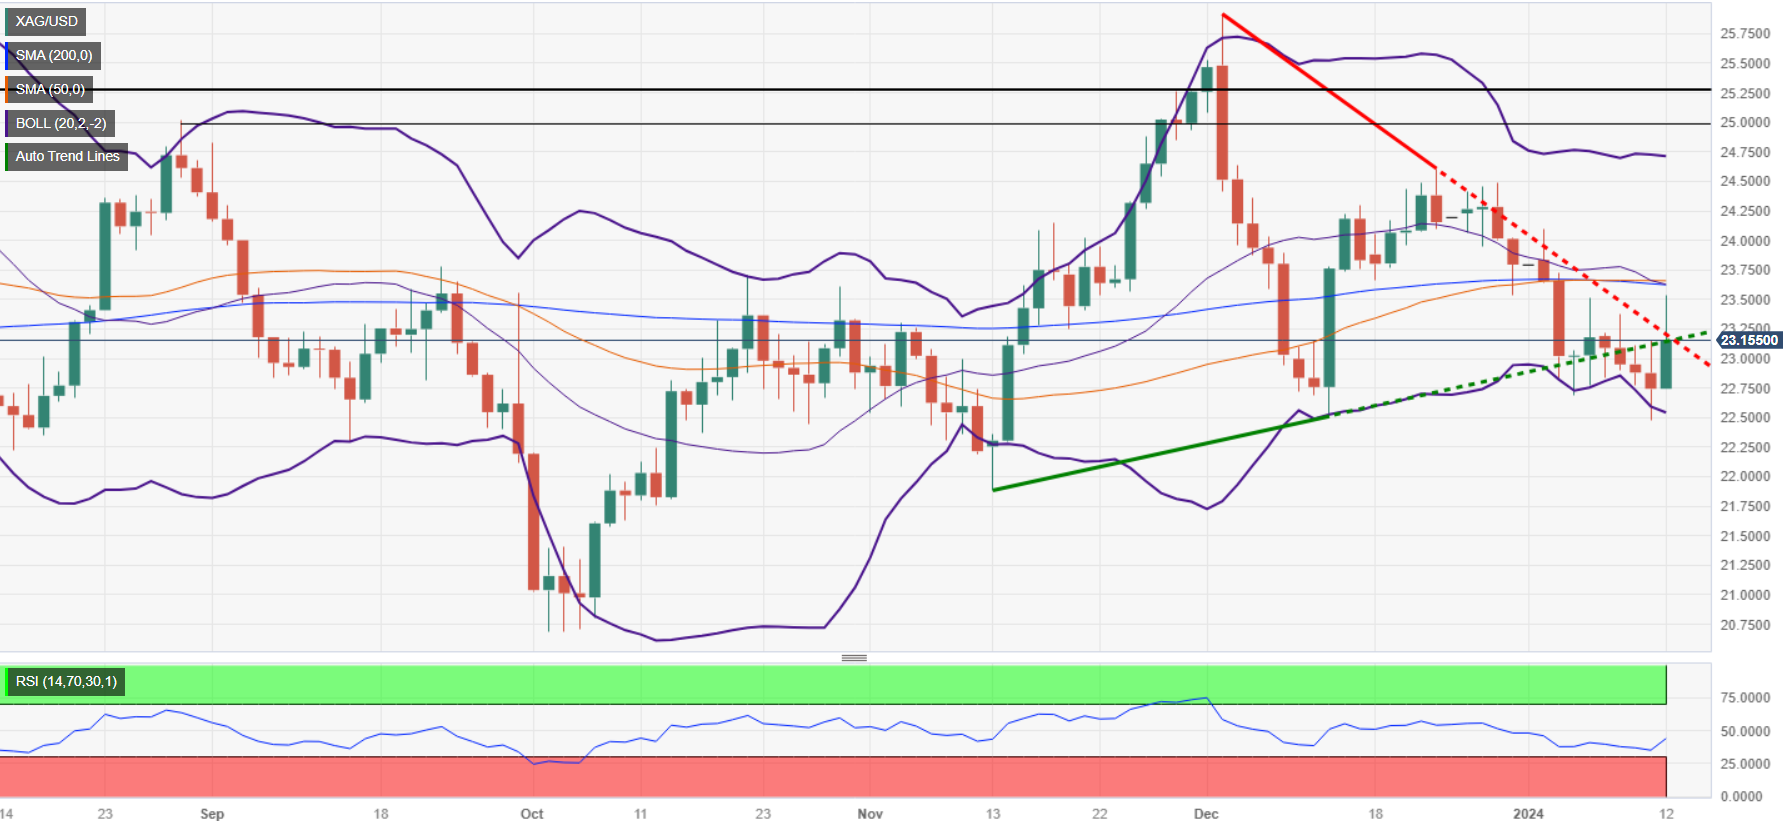
Silver price trims its losses, but it remains below the 100-day moving average (DMA) after hitting a new five-day high of $23.52 on Friday. Geopolitical tensions bolstered the grey metal, which aimed towards the confluence of the 50 and 200-DMAs, but buyers’ failure to crack that area opened the door for a pullback. The XAG/USD trades at $23.15, up by 1.85%.
The non-yielding metal remains sideways, though slightly tilted to the downside after buyers failed to conquer the confluence of the 50 and 200-DMAs. With Silver spot price trading below the 200-DMA, the first support is seen at $23.00 a troy ounce. A breach of the latter will expose the January 11 low at $22.48, followed by the $22.00 mark. Once that support level is broken, up next would be the November 13 cycle low of $21.88.
In the outcome of buyers stepping in, they would clash with the 100-DMA at $23.25. A breach of the latter will expose the confluence of the 50 and 200-DMAs at around $23.60/65, before opening the path toward $24.00.
XAG/USD Price Action – Daily Chart
XAG/USD Technical Levels
XAG/USD
| OVERVIEW | |
|---|---|
| Today last price | 23.16 |
| Today Daily Change | 0.42 |
| Today Daily Change % | 1.85 |
| Today daily open | 22.74 |
| TRENDS | |
|---|---|
| Daily SMA20 | 23.66 |
| Daily SMA50 | 23.66 |
| Daily SMA100 | 23.28 |
| Daily SMA200 | 23.63 |
| LEVELS | |
|---|---|
| Previous Daily High | 23.16 |
| Previous Daily Low | 22.48 |
| Previous Weekly High | 24.09 |
| Previous Weekly Low | 22.69 |
| Previous Monthly High | 25.92 |
| Previous Monthly Low | 22.51 |
| Daily Fibonacci 38.2% | 22.74 |
| Daily Fibonacci 61.8% | 22.9 |
| Daily Pivot Point S1 | 22.43 |
| Daily Pivot Point S2 | 22.11 |
| Daily Pivot Point S3 | 21.75 |
| Daily Pivot Point R1 | 23.11 |
| Daily Pivot Point R2 | 23.47 |
| Daily Pivot Point R3 | 23.79 |