Silver continues to gain ground in Monday’s early European trading, hovering around $22.80. The focus remains on the upcoming US January Consumer Price Index (CPI) report, which could influence silver’s direction. Currently, XAG/USD is up by 0.82% on the day.
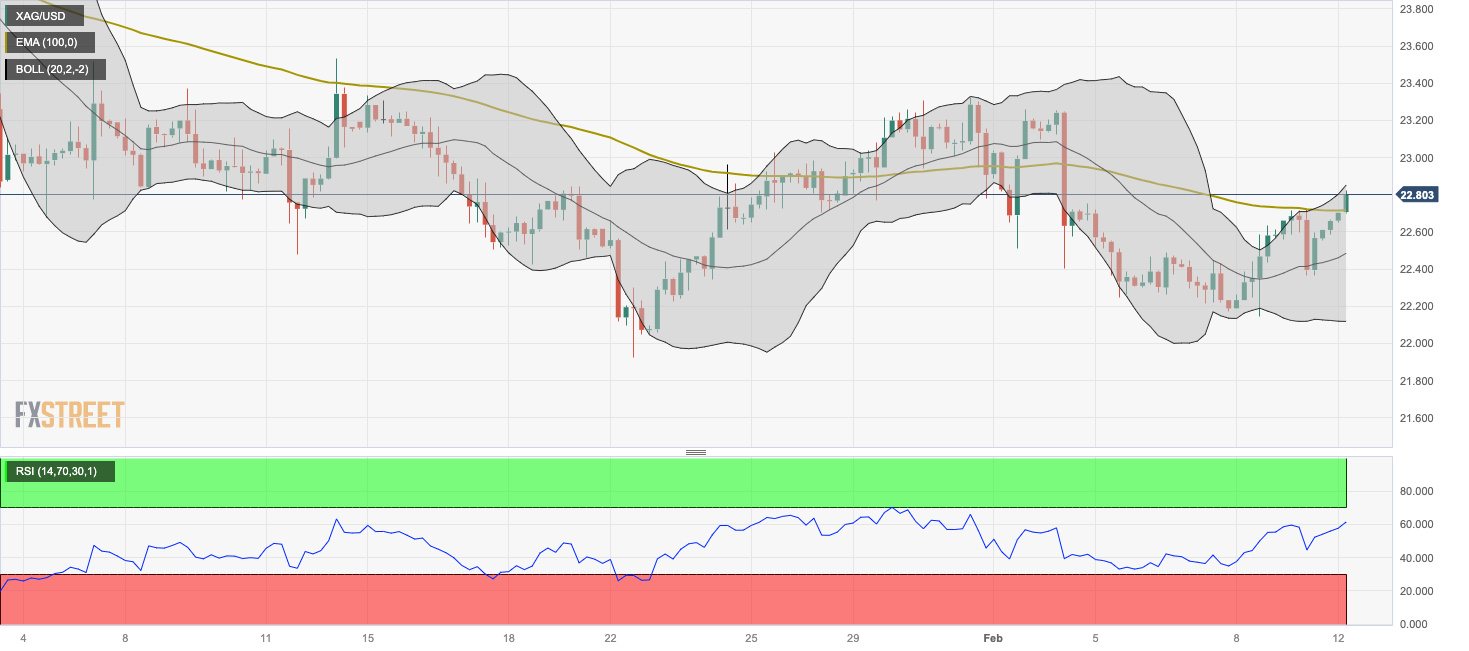
Analyzing the four-hour chart, silver’s bullish trend remains intact as it trades above the crucial 100-period Exponential Moving Average (EMA). The Relative Strength Index (RSI) also signals favorable upside momentum, sitting comfortably above the 50 midline.
A potential bullish breakout above the upper boundary of the Bollinger Band at $22.85 could pave the way for a rally towards the psychological round mark of $23.00, followed by recent highs at $23.25 and $23.53. Further upward targets include levels around $24.09.
Conversely, initial support for silver is seen at the 100-period EMA level of $22.70. A break below this support might lead to a decline towards recent lows at $22.48 and further down to the lower Bollinger Band limit at $22.10, with a potential target near $21.92, a low from January 22.
Investors are closely monitoring these levels and await the US CPI data for potential market movements.
Silver four-hour chart
XAG/USD
| OVERVIEW | |
|---|---|
| Today last price | 22.8 |
| Today Daily Change | 0.19 |
| Today Daily Change % | 0.84 |
| Today daily open | 22.61 |
| TRENDS | |
|---|---|
| Daily SMA20 | 22.71 |
| Daily SMA50 | 23.27 |
| Daily SMA100 | 23.11 |
| Daily SMA200 | 23.37 |
| LEVELS | |
|---|---|
| Previous Daily High | 22.72 |
| Previous Daily Low | 22.36 |
| Previous Weekly High | 22.75 |
| Previous Weekly Low | 22.14 |
| Previous Monthly High | 24.09 |
| Previous Monthly Low | 21.93 |
| Daily Fibonacci 38.2% | 22.59 |
| Daily Fibonacci 61.8% | 22.5 |
| Daily Pivot Point S1 | 22.41 |
| Daily Pivot Point S2 | 22.21 |
| Daily Pivot Point S3 | 22.05 |
| Daily Pivot Point R1 | 22.77 |
| Daily Pivot Point R2 | 22.93 |
| Daily Pivot Point R3 | 23.13 |